美國股市連創(chuàng)新高,,但漲幅遠(yuǎn)不如奧巴馬時代
|
早在美聯(lián)儲最近下調(diào)目標(biāo)利率區(qū)間之前,,唐納德·特朗普已經(jīng)在推特上重提他最喜歡的兩個話題:美聯(lián)儲降息幅度不夠,,股市的表現(xiàn)要?dú)w功于他和共和黨。 總統(tǒng)和股票市場之間的關(guān)系沒有那么簡單,。包括總體經(jīng)濟(jì)狀況,、投資者情緒、利率,、金融刺激和全球商業(yè)環(huán)境在內(nèi)的許多因素都會影響股票的表現(xiàn),。但總統(tǒng)也并非不重要。 “政策對經(jīng)濟(jì)增長可能有幫助,,也可能沒有幫助,。”投資研究公司和價值投資基金管理公司KORR Acquisitions Group的首席執(zhí)行官肯尼斯·奧爾說,,“政策由總統(tǒng)和他的政府主導(dǎo),,但國會必須通過法律和預(yù)算來影響這些政策?!?/p> 因此,,正如《財富》雜志在6月初所做的那樣,我們決定研究一下市場在奧巴馬和特朗普執(zhí)政期間的表現(xiàn),。我們從雅虎財經(jīng)(Yahoo Finance)下載了道瓊斯指數(shù),、標(biāo)準(zhǔn)普爾500指數(shù)、納斯達(dá)克指數(shù)和羅素2000指數(shù)的歷史數(shù)據(jù),,選擇了兩位總統(tǒng)任期中相同的時間段進(jìn)行比較——從1月20日就職到執(zhí)政第三年的10月31日,。 因?yàn)樵谔乩势债?dāng)選之前,市場已經(jīng)上漲了很長一段時間,所以只看絕對數(shù)字會產(chǎn)生誤導(dǎo),。因此,,《財富》雜志選擇將兩位總統(tǒng)任期內(nèi)的市場表現(xiàn)與他上任第一天進(jìn)行比較,以便準(zhǔn)確比較兩位總統(tǒng)任內(nèi)的市場增長,。 下面是每個指數(shù)的變化圖表和分析,。如果你現(xiàn)在就想知道答案,答案是:奧巴馬執(zhí)政期間市場增長要強(qiáng)勢得多,,但有一點(diǎn)必須要提醒你注意:就在奧巴馬上任前剛剛發(fā)生了金融危機(jī),,市場因此搖搖欲墜,有很大的上升空間,。此外,,國會實(shí)施的大規(guī)模金融刺激計劃也有助于推動市場增長。 標(biāo)普500指數(shù) 標(biāo)準(zhǔn)普爾500指數(shù)的成份股都是大公司,,是以市值作為衡量標(biāo)準(zhǔn),、紐交所或納斯達(dá)克交易所最大的500家上市公司。下圖顯示了每位總統(tǒng)任內(nèi)標(biāo)普500指數(shù)的變化情況,,同樣采用了標(biāo)準(zhǔn)化的數(shù)據(jù)以便在相同的尺度下進(jìn)行比較,。 |
Before the Fed lowered its target interest rate range on Wednesday, Donald Trump was already on Twitter, touching on two of his favorite topics: how the Fed doesn’t lower interest rates enough and that the stock market’s performance is thanks to him and his Republican pals. The connection between a president and equity markets isn’t straightforward. Many factors—the general health of the economy, investors sentiment, interest rates, financial stimulus, and global business conditions, for example—affect how stocks perform. But presidents also aren’t unimportant. “Policies may or may not be helpful for economic growth,” says Kenneth Orr, CEO of investment research firm and value investment fund manager KORR Acquisitions Group. “Policies are led by the President and his Administration, but Congress must pass laws and budgets to affect those policies.” And so, as Fortune did in early June, we decided to take a look at how the markets performed during the Administrations of Barack Obama and Trump. We downloaded historical information on the Dow, S&P 500, Nasdaq, and Russell 2000 indexes from Yahoo Finance. Then we compared the same periods for both presidents: from inauguration on January 20 to Oct. 31 in their third year of office. Because the market had already run up a long way before Trump was elected, the absolute numbers would be misleading. Instead, Fortune compared the performance under each president to his initial inauguration day to get an accurate comparison of growth under each. Below are graphs and analysis for each of the sectors. For those who want the quick answer, market growth was considerably stronger under Obama, but there is an important caveat. The financial crash that occurred immediately before Obama took office left markets reeling, so there was a lot of room for them to move. Also, the massive financial stimulus enabled by Congress helped drive growth. S&P 500 The S&P 500 is all about large companies: the 500 largest public companies on either the New York Stock Exchange (NYSE) or Nasdaq exchange as measured by market capitalization. Here is a graph showing the index’s progress under each president, again normalized so both can be compared on the same scales. |

|
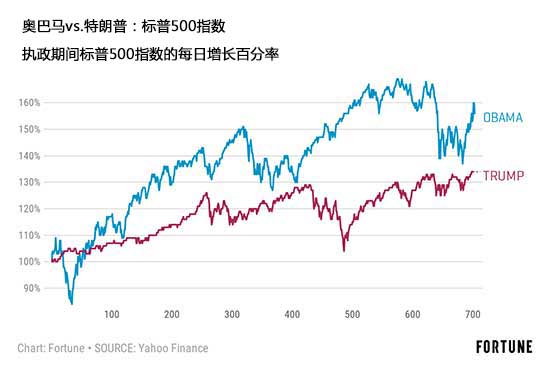
橫軸表示執(zhí)政的天數(shù),??v軸上,100%表示就職第一天的市價,,因此每條線的起點(diǎn)都是100%,。超過100%的值表示增長(例如,122%表示比第一天高22%),,低于100%的值表示降低(84%表示比第一天低16%),。 奧巴馬就職一個月左右,市場整體下行,,受到沉重打擊,,每張圖表都出現(xiàn)了同樣的下跌。2011年10月底,,標(biāo)普500指數(shù)達(dá)到奧巴馬上任第一天的156%,,這意味著該指數(shù)上漲了56%。在特朗普執(zhí)政期間,,增幅為34%,,比奧巴馬執(zhí)政時期低了22個百分點(diǎn)。 道瓊斯指數(shù) 道瓊斯指數(shù)(道瓊斯工業(yè)平均指數(shù),,Dow Jones Industrial Average)由30家大盤股公司組成,,均為道瓊斯公司(Dow Jones & Company)專門挑選出來用以代表整體經(jīng)濟(jì),。它們都是在紐交所或納斯達(dá)克上市的大型公司,收益穩(wěn)定,。 |
Each horizontal axis shows the number of days in office. On the vertical axis, 100% means the same value on the first day in office, which is why each line starts at 100%. Any value over 100% shows an increase (122% means 22% higher than the first day, for example) and a value under 100% shows a decrease (84% means 16% less than the first day). The downward dip about a month in under the Obama administration is a general blow the entire market took and which appears in each graph. By the end of October 2011, the S&P 500 hit 156% of the value it had on Obama’s first day, which means the index increased by 56%. Under Trump, the increase was 34%, or 22 percentage points lower than the gain under Obama. Dow While the Dow (or Dow Jones Industrial Average) consists of 30 large cap companies, they are chosen specifically by Dow Jones & Company in an attempt to represent the broader economy. They are all large public companies with stable earnings that are on the NYSE or Nasdaq. |

|
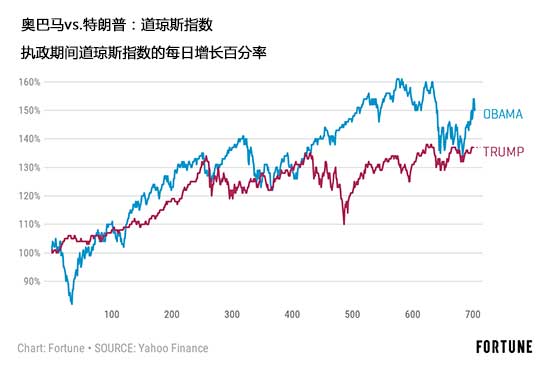
兩屆政府之間道指的差異要小得多。奧巴馬執(zhí)政期間,,道指的百分比變化大約為150%,也就是說比初始值增加了50%,。在特朗普執(zhí)政期間,,百分比變化為136%,即增長了36%,,比奧巴馬政府少14個百分點(diǎn),。 納斯達(dá)克指數(shù) 納斯達(dá)克有兩個意思。它和紐約證券交易所一樣,,是一個人們可以買賣股票的證券交易所,。但它同時也是股票指數(shù),成份股中有很多是高科技公司,。因此,,人們已經(jīng)把納斯達(dá)克指數(shù)視為投資者快速了解創(chuàng)新依賴型公司最新動向的方式。 |
The difference in the Dow between the two administrations is significantly smaller. The percentage change under Obama was roughly 150%, meaning a 50% increase over the initial value. Under Trump, the 136% change, or 36% gain in value, was 14 percentage points less. Nasdaq Nasdaq means two things. Like the NYSE, it’s a stock exchange where people can buy and sell shares. But it is also an index of stocks, many of which are high tech companies. So the Nasdaq index has come to be considered a quick way for investors to check the pulse of companies that depend heavily on innovation. |

*100%等于上任第一天的全部市值,。
|
納斯達(dá)克指數(shù)的差別很大,。從特朗普上任第一天算起,到目前為止,,納斯達(dá)克指數(shù)的百分比變化為149%,,漲幅為49%。而在奧巴馬執(zhí)政期間,,同期百分比變化為186%,,漲幅為86%,比特朗普高出37個百分點(diǎn),。 羅素2000指數(shù) 以上所有指數(shù)的成分股都是大盤股或大部分是大盤股,。羅素2000指數(shù)正好相反:由2000家規(guī)模最小的上市公司組成。投資者用這個指數(shù)來監(jiān)測小公司的發(fā)展,。 |
The difference here is strong. Up to now, measured from Trump’s first day, the Nasdaq has seen a 149% change for an increase of 49%. At the same point under Obama, it was a change of 186%—an icrease of 86%, or 37 percentage points more than for Trump. Russell 2000 All of the above indexes are either entirely or heavily large cap stocks. The Russell 2000 is the opposite: 2000 of the smallest public companies. Investors use this index to monitor the progress of smaller companies. |
?

|
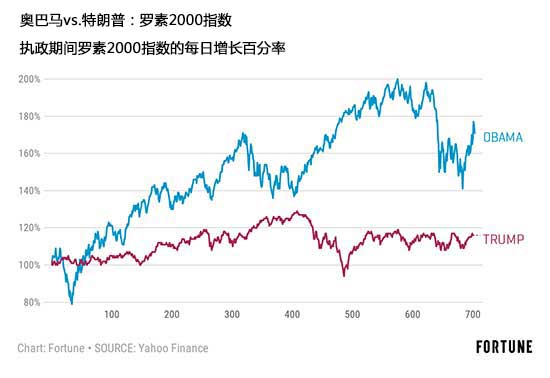
羅素2000指數(shù)在兩位總統(tǒng)執(zhí)政期間的表現(xiàn)差異最大。奧巴馬執(zhí)政期間的變化幅度為171%,,增幅為71%,,遠(yuǎn)比特朗普執(zhí)政期間的變化幅度116%(僅增長16%)高,高出55個百分點(diǎn),。 但兩位總統(tǒng)執(zhí)政期間的經(jīng)濟(jì)環(huán)境和具體情況各不相同,。當(dāng)前經(jīng)濟(jì)進(jìn)入減速周期的公認(rèn)事實(shí)以及奧巴馬上臺后實(shí)施的大規(guī)模經(jīng)濟(jì)刺激計劃等因素都對結(jié)果產(chǎn)生了影響,。不過,過去的十年漫長而表現(xiàn)強(qiáng)勁,。 “每位總統(tǒng)都應(yīng)該算贏,。”金融顧問,、前外匯交易員莫里斯·阿姆斯特朗表示,,“我認(rèn)為現(xiàn)任政府應(yīng)當(dāng)因?yàn)榫S持經(jīng)濟(jì)不下沉而贏得大家的贊揚(yáng),而且早期實(shí)現(xiàn)反彈要比后面容易,?!?/p> 至于不管誰將在2020年勝出?“下一任總統(tǒng)的就職禮物可能是經(jīng)濟(jì)衰退,?!卑⒛匪固乩收f。(財富中文網(wǎng)) 譯者:Agatha |
The Russell showed the largest difference under the two presidents. A change of 171%—a gain of 71%— during the Obama administration was a whopping 55 percentage points more than Trump’s 116% change, only a 16% increase. But the economy climate and particulars for each president vary widely. Such factors as a generally acknowledged slowing business cycle now and the massive stimulus packages put into place as Obama took office have impacts on results. Still, it’s been a long and strong ride for the last ten years. “Each president deserves a win,” says financial advisor and former currency trader Morris Armstrong. “I think that the government deserves collective credit for keeping our economy afloat, that the early bounce is easier than the mature bounce.” As to whoever wins in 2020? “The next president will likely have a recession as an inauguration gift,” Armstrong says. |


