今年2月和3月,,美股下跌的速度和混亂程度讓人抓狂。3月是自大蕭條以來股市波動性最大的一個月,。
但由于新冠疫情導致的痛苦和困擾,,出現(xiàn)這種行情從許多方面來看都是合情合理的。
從3月末以來市場反彈的速度和爆發(fā)力,,讓許多市場參與者難以理解,。股市反彈的主要原因是幾乎在市場進入熊市的同時,美國政府出臺了財政和貨幣響應措施,。
但即便在政府的干預下,,也不會有投資者能想到,股市在3月23日才剛剛觸底,,能夠反彈到當前的水平,。
3月23日,標普500指數暴跌近34%,,之后反彈了36%,,但距離其最高點依舊下跌了9.7%:
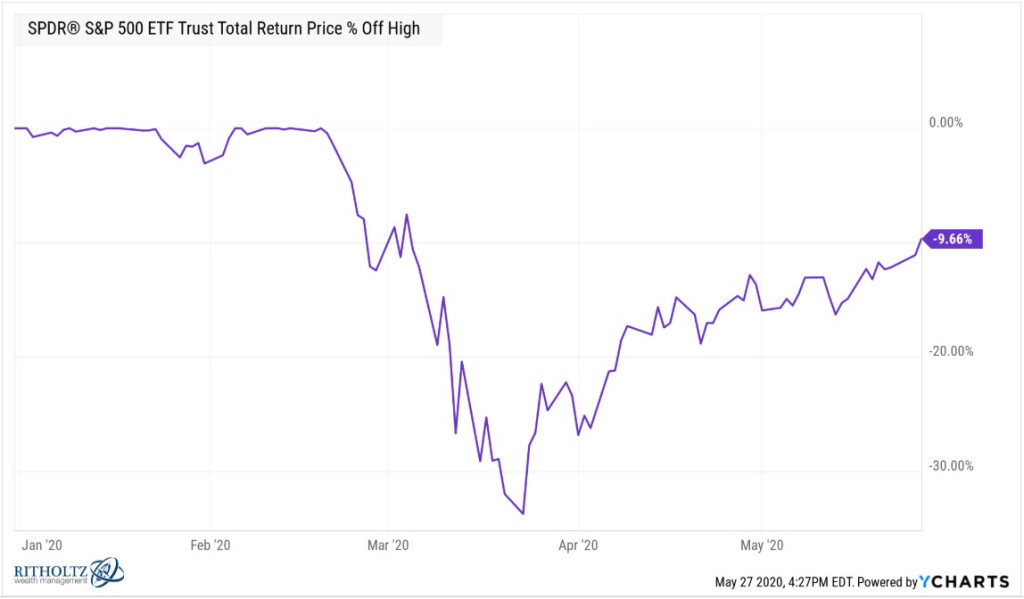
你很難相信經歷過一場崩盤之后,標普500指數的同比下跌幅度只有個位數,。
在危機期間,,最大科技股始終保持良好的勢頭。由于納斯達克100指數以大型科技公司為主,,因此該指數是今年表現(xiàn)最好的指數之一,。盡管亞馬遜(Amazon)、蘋果(Apple),、微軟(Microsoft)和谷歌(Google)等公司的股票依舊堅挺,,但在股市崩盤期間,納斯達克100指數依舊下跌了近30%:
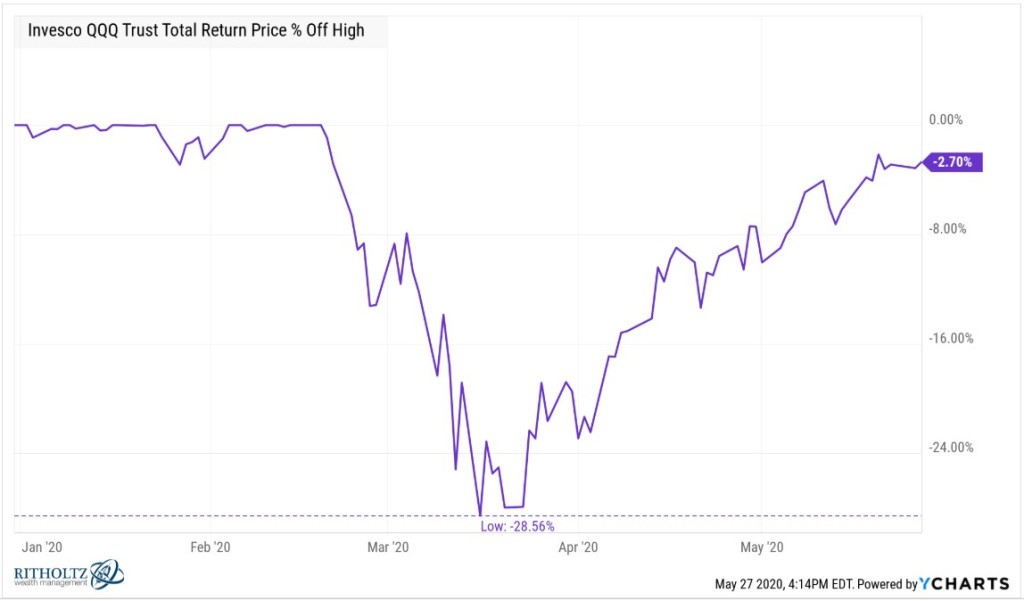
現(xiàn)在,,該指數已經收復了大部分失地,,并且同比上漲了近9%,距離最高點只相差不足3%,。
此輪下跌對小盤股的沖擊更大:
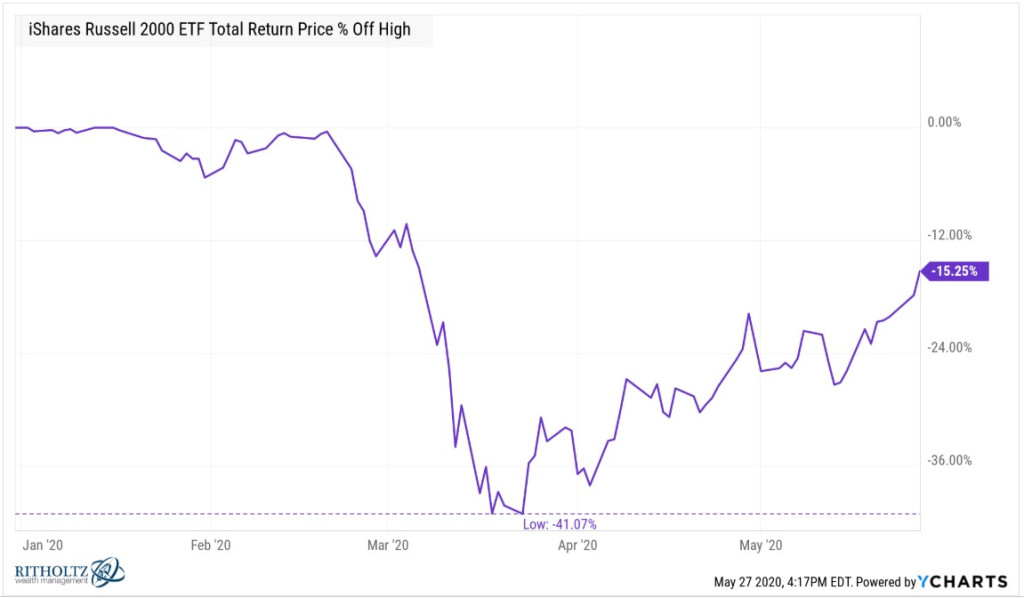
小盤股雖然也有大幅反彈,,但美國三個股票市場過去一年的反彈幅度各有不同:
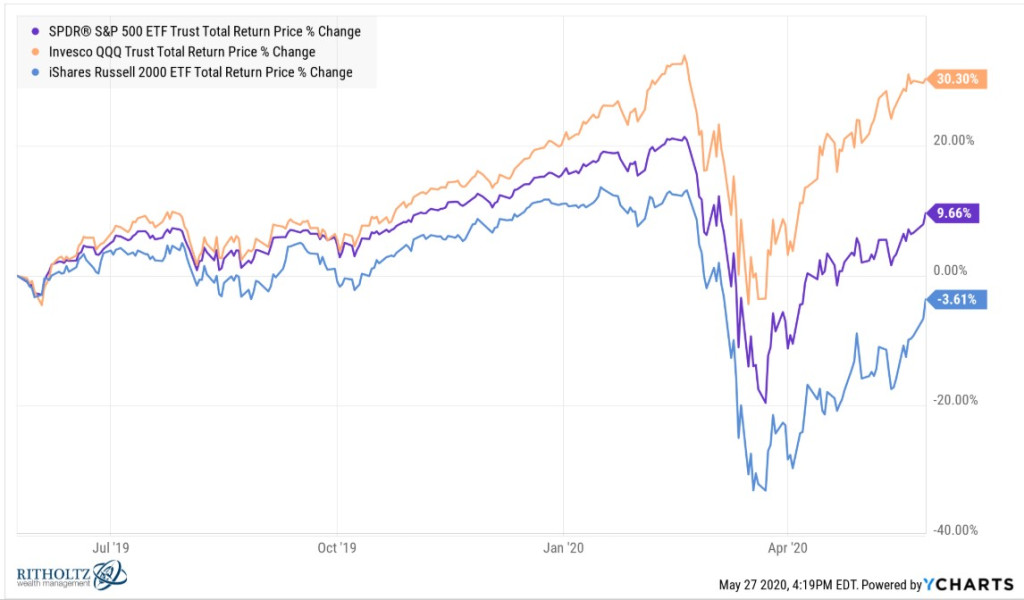
納斯達克100指數雖然暴跌了29%,但過去12個月上漲超過30%,,而小盤股卻下跌近4%,。
在2008年金融危機期間,新興市場的股市跌幅接近70%(標普500指數跌幅為56%),,但讓人意外的事,,在此輪熊市中,,發(fā)展中國家的股市竟然與美國大盤股的跌幅相當:
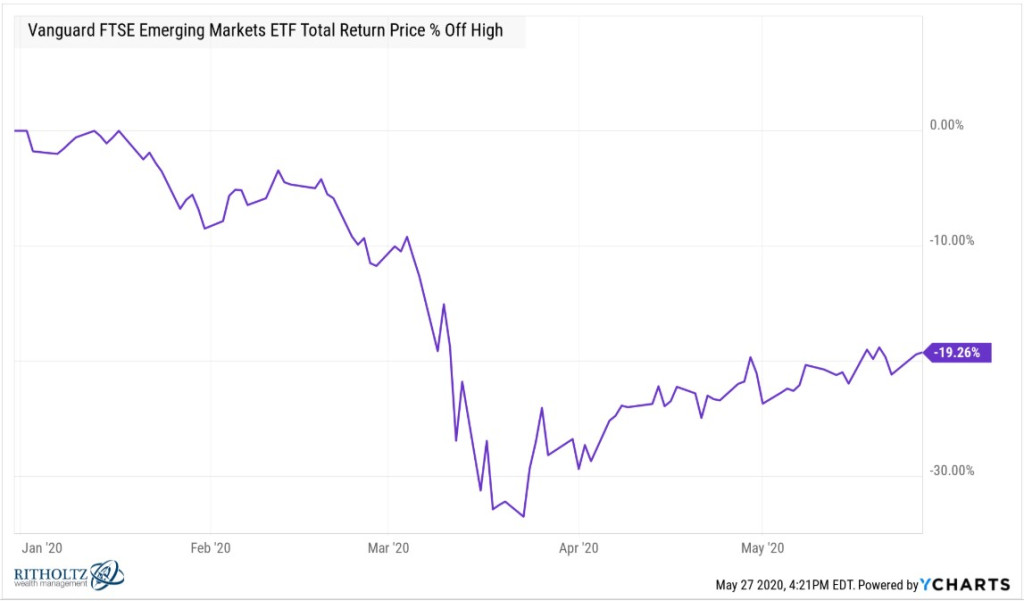
但新興市場沒有出現(xiàn)相同幅度的反彈,所以今年這些地區(qū)的股市跌幅依舊接近20%,。
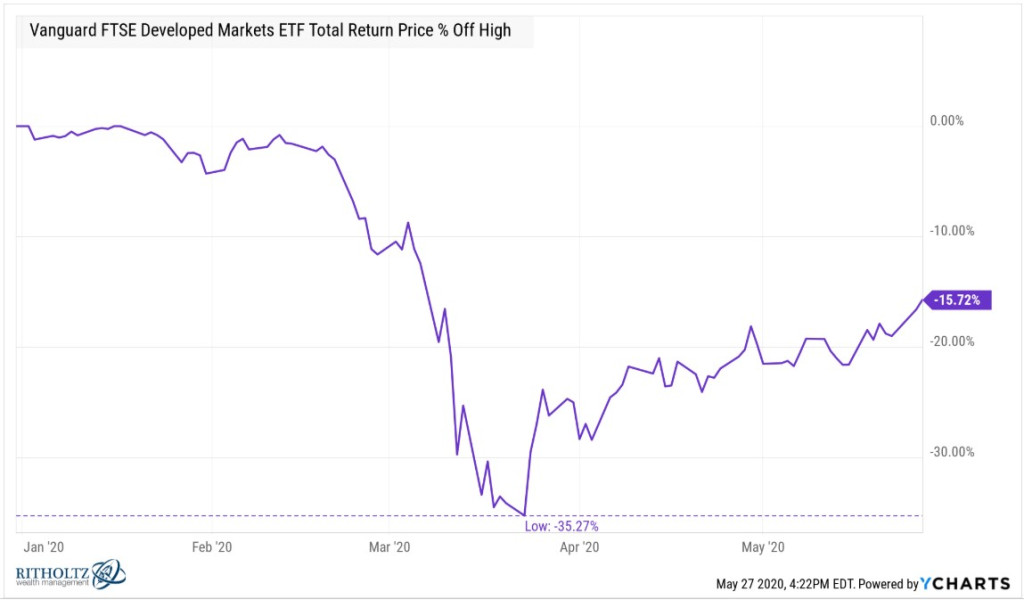
在此輪股市崩盤中,,其他發(fā)達市場的跌幅實際上大于新興市場,但發(fā)達市場的反彈更加明顯,。
下文總結了自3月23日至5月27日收盤每個市場的反彈情況:
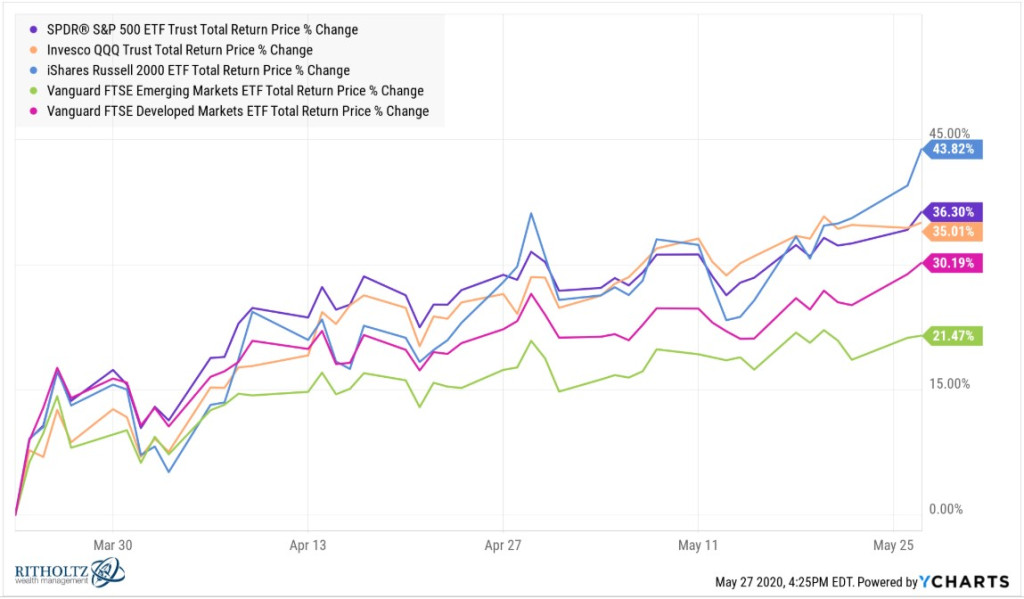
排在首位的是誰,?小盤股,上漲超過43%,。在熊市過后,,小公司往往會領漲,因為:
(1)它們在市場崩盤情境中遭到嚴重沖擊,,并且
(2)市場中風險更高的要素通常會引領市場走出危機
綜合這些數據,,你會發(fā)現(xiàn)全球股市都已經收回了自3月末以來的大部分損失:

標普500指數不同行業(yè)從本輪熊市的低谷反彈的趨勢,也給我們一些啟示:
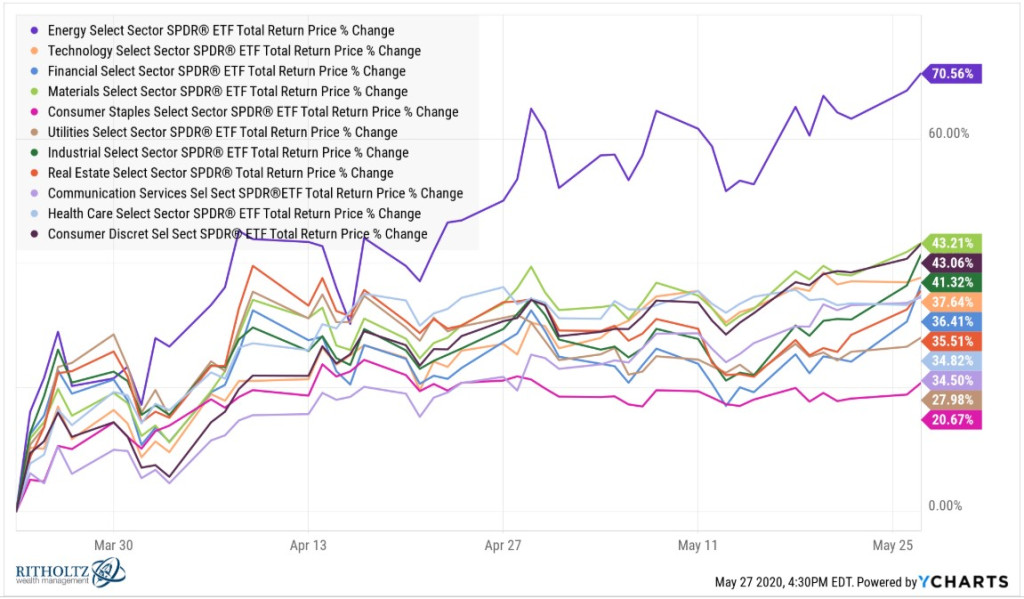
多年來,,能源股始終低迷,,但在此次危機期間,能源股的跌幅高達59.86%,,遠超過其他行業(yè),。
科技股經過初期的穩(wěn)定和后期上漲之后,年初至今的反彈幅度為6.37%,,領先于其他行業(yè),,消費者服務和非必需消費品行業(yè)也大幅反彈,而排在最后的是醫(yī)療保健與能源股,,分別下跌20.97%和31.55%,,
2020年只過去了不到一半,但我們似乎已經走完了正常情況下需要幾年時間才能走完的3個不同周期,。
真是瘋狂的一年,! (財富中文網)
本文作者是注冊金融分析師本?卡爾森(Ben Carlson),他是里薩茲財富管理公司(Ritholtz Wealth Management)機構資產管理部門的主任,。作者可能持有文中提及的證券或資產,。
譯者:Biz
今年2月和3月,美股下跌的速度和混亂程度讓人抓狂,。3月是自大蕭條以來股市波動性最大的一個月。
但由于新冠疫情導致的痛苦和困擾,,出現(xiàn)這種行情從許多方面來看都是合情合理的,。
從3月末以來市場反彈的速度和爆發(fā)力,讓許多市場參與者難以理解,。股市反彈的主要原因是幾乎在市場進入熊市的同時,,美國政府出臺了財政和貨幣響應措施,。
但即便在政府的干預下,也不會有投資者能想到,,股市在3月23日才剛剛觸底,,能夠反彈到當前的水平。
3月23日,,標普500指數暴跌近34%,,之后反彈了36%,但距離其最高點依舊下跌了9.7%:
你很難相信經歷過一場崩盤之后,,標普500指數的同比下跌幅度只有個位數,。
在危機期間,最大科技股始終保持良好的勢頭,。由于納斯達克100指數以大型科技公司為主,,因此該指數是今年表現(xiàn)最好的指數之一。盡管亞馬遜(Amazon),、蘋果(Apple),、微軟(Microsoft)和谷歌(Google)等公司的股票依舊堅挺,但在股市崩盤期間,,納斯達克100指數依舊下跌了近30%:
現(xiàn)在,,該指數已經收復了大部分失地,并且同比上漲了近9%,,距離最高點只相差不足3%,。
此輪下跌對小盤股的沖擊更大:
小盤股雖然也有大幅反彈,但美國三個股票市場過去一年的反彈幅度各有不同:
納斯達克100指數雖然暴跌了29%,,但過去12個月上漲超過30%,,而小盤股卻下跌近4%。
在2008年金融危機期間,,新興市場的股市跌幅接近70%(標普500指數跌幅為56%),,但讓人意外的事,在此輪熊市中,,發(fā)展中國家的股市竟然與美國大盤股的跌幅相當:
但新興市場沒有出現(xiàn)相同幅度的反彈,,所以今年這些地區(qū)的股市跌幅依舊接近20%。
在此輪股市崩盤中,,其他發(fā)達市場的跌幅實際上大于新興市場,,但發(fā)達市場的反彈更加明顯。
下文總結了自3月23日至5月27日收盤每個市場的反彈情況:
排在首位的是誰,?小盤股,,上漲超過43%。在熊市過后,,小公司往往會領漲,,因為:
(1)它們在市場崩盤情境中遭到嚴重沖擊,,并且
(2)市場中風險更高的要素通常會引領市場走出危機
綜合這些數據,你會發(fā)現(xiàn)全球股市都已經收回了自3月末以來的大部分損失:
標普500指數不同行業(yè)從本輪熊市的低谷反彈的趨勢,,也給我們一些啟示:
多年來,,能源股始終低迷,但在此次危機期間,,能源股的跌幅高達59.86%,,遠超過其他行業(yè)。
科技股經過初期的穩(wěn)定和后期上漲之后,,年初至今的反彈幅度為6.37%,,領先于其他行業(yè),消費者服務和非必需消費品行業(yè)也大幅反彈,,而排在最后的是醫(yī)療保健與能源股,,分別下跌20.97%和31.55%,
2020年只過去了不到一半,,但我們似乎已經走完了正常情況下需要幾年時間才能走完的3個不同周期,。
真是瘋狂的一年! (財富中文網)
本文作者是注冊金融分析師本?卡爾森(Ben Carlson),,他是里薩茲財富管理公司(Ritholtz Wealth Management)機構資產管理部門的主任,。作者可能持有文中提及的證券或資產。
譯者:Biz
The speed and turbulence of the stock market’s downturn in February and March was insane. March was the most volatile month since the Great Depression.
The move made sense in many ways, though, because of the pain and confusion caused by the pandemic.
The speed and explosiveness of the market’s rally since late-March is more of a head-scratcher to many market participants. Much of this recovery can be attributed to the fact that the fiscal and monetary response occurred nearly as fast as the bear market itself.
Even with government interventions, I’m not sure any investors would have assumed stocks would be at current levels when they bottomed on March 23.
The S&P 500 was down close to 34% that day and remains in a 9.7% drawdown following a 36% rally ever since:
?
It’s hard to believe after the crash we experienced that the S&P 500 is now showing just single-digit losses on the year.
The biggest tech stocks have held up extremely well throughout the crisis. Since they make up the majority of the Nasdaq 100, that remains one of the best performing indexes this year. Despite the strength in stocks like Amazon, Apple, Microsoft and Google, the Nasdaq 100 did fall nearly 30% in the crash:
?
It’s now less than 3% off the highs after recovering most of those losses and up almost 9% on the year.
Small-cap stocks were hit much harder than large-cap stocks in the downturn:
?
Small caps have experienced a nice bounce but it really is a tale of 3 markets when you look at the returns of these 3 subsets of the U.S. stock market over the past year:
?
Even with a 29% nose-dive, the Nasdaq 100 is up more than 30% over the past 12 months while small-cap stocks are down nearly 4%.
In the 2008 crisis, emerging markets fell close to 70% (against a 56% fall for the S&P 500) so it may come as a surprise to learn developing country stocks had roughly the same drawdown as large U.S. corporations in this bear market:
?
Emerging markets haven’t had the same level of recovery so it remains down nearly 20% this year.
Foreign developed markets actually fell more than emerging markets in this slump but have seen a more pronounced rally:
?
Here is the summary of the rebounds in each of these markets since the bottom on March 23rd through the close on May 27th:
?
At the head of the pack? Small-cap stocks, which have have surged more than 43%. Smaller companies tend to lead the way following a bear market because:
(1) they get hit so hard during a market crash scenario and
(2) the riskier elements of the market typically lead the way coming out of a crisis
Putting this all together you can see stock markets around the world have made up a majority of their losses since late-March:
?
The S&P 500 sector returns from the bottom of this bear market are also telling:
?
Energy stocks have been getting crushed for a number of years now but they got pummeled more than any sector during the crisis, down 59.86%.
After the initial flush and subsequent advance, tech stocks have been leading the way with a YTD return of 6.37%, consumer services and consumer discretionary are also in the green, while Health Care and Energy are pulling up the rear at -20.97 and -31.55 respectively.
It feels like we’ve already lived through 3 different cycles that would normally take place over the course of a number of years and 2020 hasn’t even reached the halfway point yet.
What a wild year.
Ben Carlson, CFA, is the director of institutional asset management at Ritholtz Wealth Management. He may own securities or assets discussed in this piece.


