

美股前景恐難看好,,原因有這五點
Shawn Tully
2022-01-10
以可靠標準衡量,,美股價格比1998年至2000年科技泡沫以來都昂貴。
 文本設(shè)置
 Plus(0條)

2021年11月底和12月初,,華爾街的市場策略師沿襲了由來已久的節(jié)日儀式,,即預(yù)測新一年的標準普爾500指數(shù)(S&P 500)點位。傳統(tǒng)上,,即使在基本面提示應(yīng)該謹慎,,比如相對歷史基準股價顯示出明顯高估跡象,預(yù)測者也會不切實際地偏向多頭,。2020年年底的股票看起來已經(jīng)很昂貴,,多數(shù)銀行還是預(yù)測2021年漲幅可達兩位數(shù)。摩根大通(J.P. Morgan)最樂觀,,預(yù)測漲幅達17%,,其次是高盛(Goldman Sachs)和瑞銀(UBS),預(yù)測漲幅分別為14%和11%,。美國銀行(Bank of America)和花旗集團(Citigroup)未跟隨大流,,發(fā)出了泡沫警告,,預(yù)測增幅也最小,不過沒有一家華爾街巨頭預(yù)計出現(xiàn)大幅下跌,。
當然,實際情況是在象征幸運的知更鳥的喧囂中,,2021年投資者將標準普爾500指數(shù)推高了27.2%,,收于4766點。井噴后大盤股進入全新領(lǐng)域,,以可靠標準衡量,,大盤股價比1998年至2000年科技泡沫以來都昂貴。
然而,,人們可能認為銀行會想方設(shè)法吹捧2022年前景大好,。我期待著跟往年一樣特別正面的預(yù)期,銀行宣稱有望超越超高估值,,推動標準普爾指數(shù)漲幅再次達到兩位數(shù),。令人驚訝的是,事實并非如此,。2021年年底,,華爾街發(fā)布的股價報告數(shù)量極為有限,而且處處是警告,。提醒投資者:如果連股票的終極炒作工廠都認為未來12個月內(nèi)大盤股走勢幾乎持平,,可能預(yù)期里還要加大折扣。
當然,,即便是最可靠的市場指標也無法預(yù)測短短一年內(nèi)股票的走勢,。諸如表情包熱之類現(xiàn)象,還有推動電動汽車制造商和技術(shù)熱門公司股票估值高到驚人,,導(dǎo)致短期預(yù)測非常不可靠的驚人勢頭,。網(wǎng)絡(luò)狂潮期間,1997年年中,,標準普爾指數(shù)看起來高估到危險的程度,,但在不可避免的崩潰之前,標準普爾還是繼續(xù)飆升了三年,。這一次,,華爾街發(fā)出了警告。銀行對2022年謹慎的稱贊,,還有為未來一年“疲軟”引述的各種理由都是強大的障礙,。說明不只今后12個月,長久的未來回報都將低迷,。
華爾街預(yù)測2022年收益微乎其微
與2021年的收獲相比,,銀行對今年標準普爾500指數(shù)目標關(guān)乎低位高點和低位低點。在預(yù)測2022年年底點位的九家大型銀行中,最樂觀的預(yù)測來自瑞士信貸(Credit Suisse),。瑞信預(yù)計指數(shù)將接近5100,,標準普爾500指數(shù)漲幅將達到9.1%,遠低于摩根大通預(yù)測的2021年上漲17%,。預(yù)測點位第二高的是高盛,,預(yù)測漲幅7%,隨后是摩根大通和蘇格蘭皇家銀行(RBC)均為6%,、德意志銀行(Deutsche Bank)為4.9%和花旗銀行(Citi Bank)為2.8%,。最讓人驚訝的是平淡和負面預(yù)期。巴克萊銀行(Barclays)預(yù)計標準普爾500指數(shù)僅增長0.7%,,而美國銀行預(yù)計下跌3.5%,。最悲觀的是摩根士丹利(Morgan Stanley),預(yù)計到2022年年底,,標準普爾指數(shù)將下跌7.7%,。
九家銀行的平均預(yù)測增幅為2.8%。標準普爾還會派息1.3%,。再加上2.8%的資本收益,,華爾街明確預(yù)計2022年總回報率為4.1%。2021年11月,,消費者價格指數(shù)(CPI)飆升至6.8%,,即便通脹如美聯(lián)儲(Federal Reserve)預(yù)測放緩至2.6%,如果銀行突然謹慎的專家預(yù)測準確,,投資者的“實際”收益就只能說微乎其微,。
不過讓華爾街對2022年偏消極的推動力并未消失,而且比追求積極的智者承認的強大得多,。未來12個月內(nèi)各種不利因素可能不會出現(xiàn),,但未來幾年將嚴重影響股價。對未來回報來說,,基本面似乎很糟糕,。以下是長期來看股票表現(xiàn)不佳的五個原因。
理由1:估值高到危險程度
要評估股票高估程度,,不僅要看價格相對于收益上漲了多少,,還要看當前巨額利潤是否可持續(xù)。如果不可持續(xù),,官方市盈率(P/E)就大大低估了股票的昂貴程度,。
2021年年底根據(jù)截至去年三季度每股收益(EPS)計算,標準普爾500指數(shù)的市盈率為27.2倍,。排除2000年幾個季度利潤暴跌導(dǎo)致市盈率膨脹,,該市盈率為20年前的科技泡沫以來最高,。華爾街的狂熱者聲稱,當前基于未來收益的市盈率仍然在合理范圍內(nèi),,因為利潤將持續(xù)飆升,。但他們錯了。事實上,,企業(yè)利潤處于泡沫高點,,已經(jīng)沒有擴張空間。即便收益增長也無法拯救當前極高的估值,。
2019年四季度,標準普爾500指數(shù)的每股收益創(chuàng)下139.47美元的歷史新高,。然后新冠病毒席卷而來,,大盤股公司利潤從強勁變?yōu)楹郎荨U疄閼?yīng)對危機投入大量資金,,為家庭帶來數(shù)萬億美元現(xiàn)金,。從電腦設(shè)備到改造農(nóng)場或土地,人們大手筆購買各種家庭用品和服務(wù),。從2021年二季度開始,,盈利出現(xiàn)了幾十年來從未出現(xiàn)的大幅上漲,2021年三季度躍升至175美元,,比15個月前設(shè)定目標的高點多出25%,。問題在于:營業(yè)利潤率以及盈利都觸及天花板。2021年三季度標準普爾500指數(shù)成份股公司營業(yè)利潤率達到13.2%,,高過了2019年四季度的10.6%,,當時標準普爾點位達到新冠疫情前高點。目前,,銷售占營業(yè)收入的比例比過去12年平均水平高出40%,。
如今,不斷上漲的勞動力成本正在壓縮盈利,。Research Affiliates的首席執(zhí)行官兼首席投資官克里斯·布萊曼告訴《財富》雜志,,利潤快速增長的時代已經(jīng)結(jié)束。Research Affiliates負責管理1660億美元共同基金和ETF的投資策略,。他預(yù)測,,在本十年的大部分時間里,每股收益很可能出現(xiàn)橫向波動,,與通脹基本持平,。
原因2:席勒市盈率亮紅燈
決定未來回報豐厚還是貧瘠的最佳標準是看起點。如果整體價格便宜,,付出的每一美元就都能夠獲得大量利潤,,感覺就像盒子里裝滿了脆米花,,豐收的可能性比較高。如果股票現(xiàn)在賺的錢少,,那么要獲得兩位數(shù)的收益,,最好期盼企業(yè)利潤可以實現(xiàn)快速增長。
然而,,當前利潤實在巨大,,除了下跌或橫盤已經(jīng)無處可去。一個有價值的指標表明,,如果從每股收益中剔除無法維持的峰值,,剩下的“正常化”利潤低得多,。結(jié)果是為每股支付的美元遠高于可期待的利潤,。判斷標準是耶魯大學的經(jīng)濟學家,也是諾貝爾獎的獲得者羅伯特·希勒制定的周期調(diào)整市盈率(CAPE),。CAPE計算過去10年平均每股收益(經(jīng)通脹調(diào)整),,消除短期利潤高峰和低谷造成的扭曲。事實上,,希勒市盈率是預(yù)測未來十年股市表現(xiàn)最可靠的指標之一,。
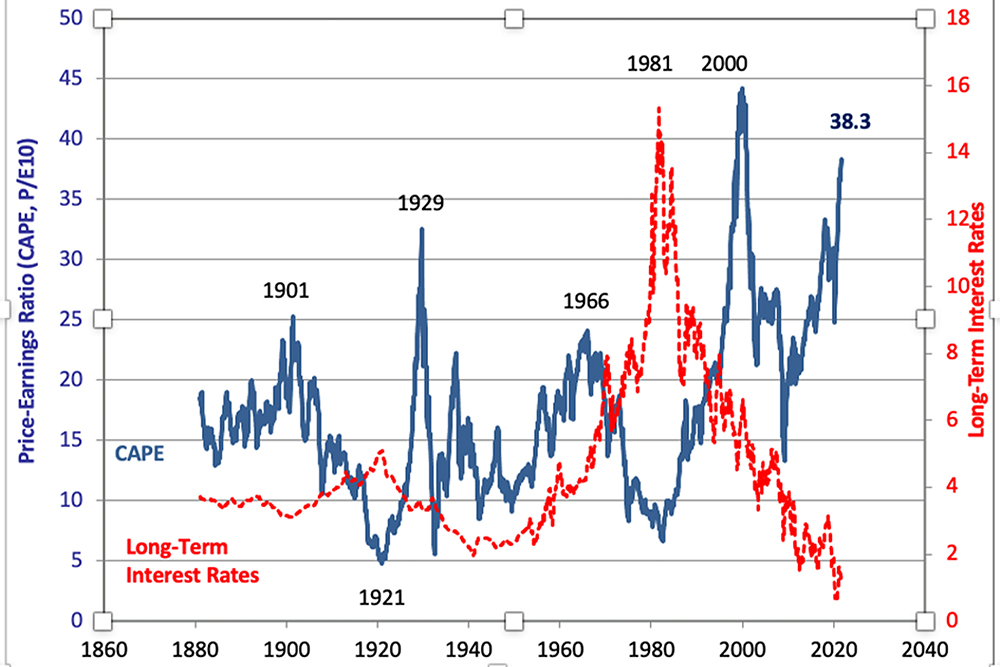
現(xiàn)在,CAPE達到40倍,。自1877年以來,,CAPE達到如此高僅出現(xiàn)過一次,就是1998年年初至2000年年底的互聯(lián)網(wǎng)熱潮,,持續(xù)了21個月,。接下來的三年里,CAPE指標下降了43%,;過了13年,,標準普爾的席勒市盈率才恢復(fù)到接近40的水平。
理由3:“真實”利率將上升,,最終導(dǎo)致市盈率崩潰
最令華爾街困擾的是美聯(lián)儲最近承諾明年加息,。解釋2022年的目標點位時,各銀行承認美聯(lián)儲政策轉(zhuǎn)變會為當前超高市盈率造成壓力,。這是美國銀行的分析師薩維塔·薩布拉瑪尼安預(yù)測今年標準普爾將下跌3.5%的重要原因,。由于波動性股票與無風險債券都在爭取投資者的資金,國債收益率越低,,投資者就越愿意為風險更高的對家買單,。沃倫·巴菲特強調(diào),,10年期國債收益率從1984年的13%以上降到2000年代中期的4%,是推動多年牛市的首要因素,。近幾年來,,美聯(lián)儲政策變成愈加強力的補藥,股市看多派聲勢日益浩大,。
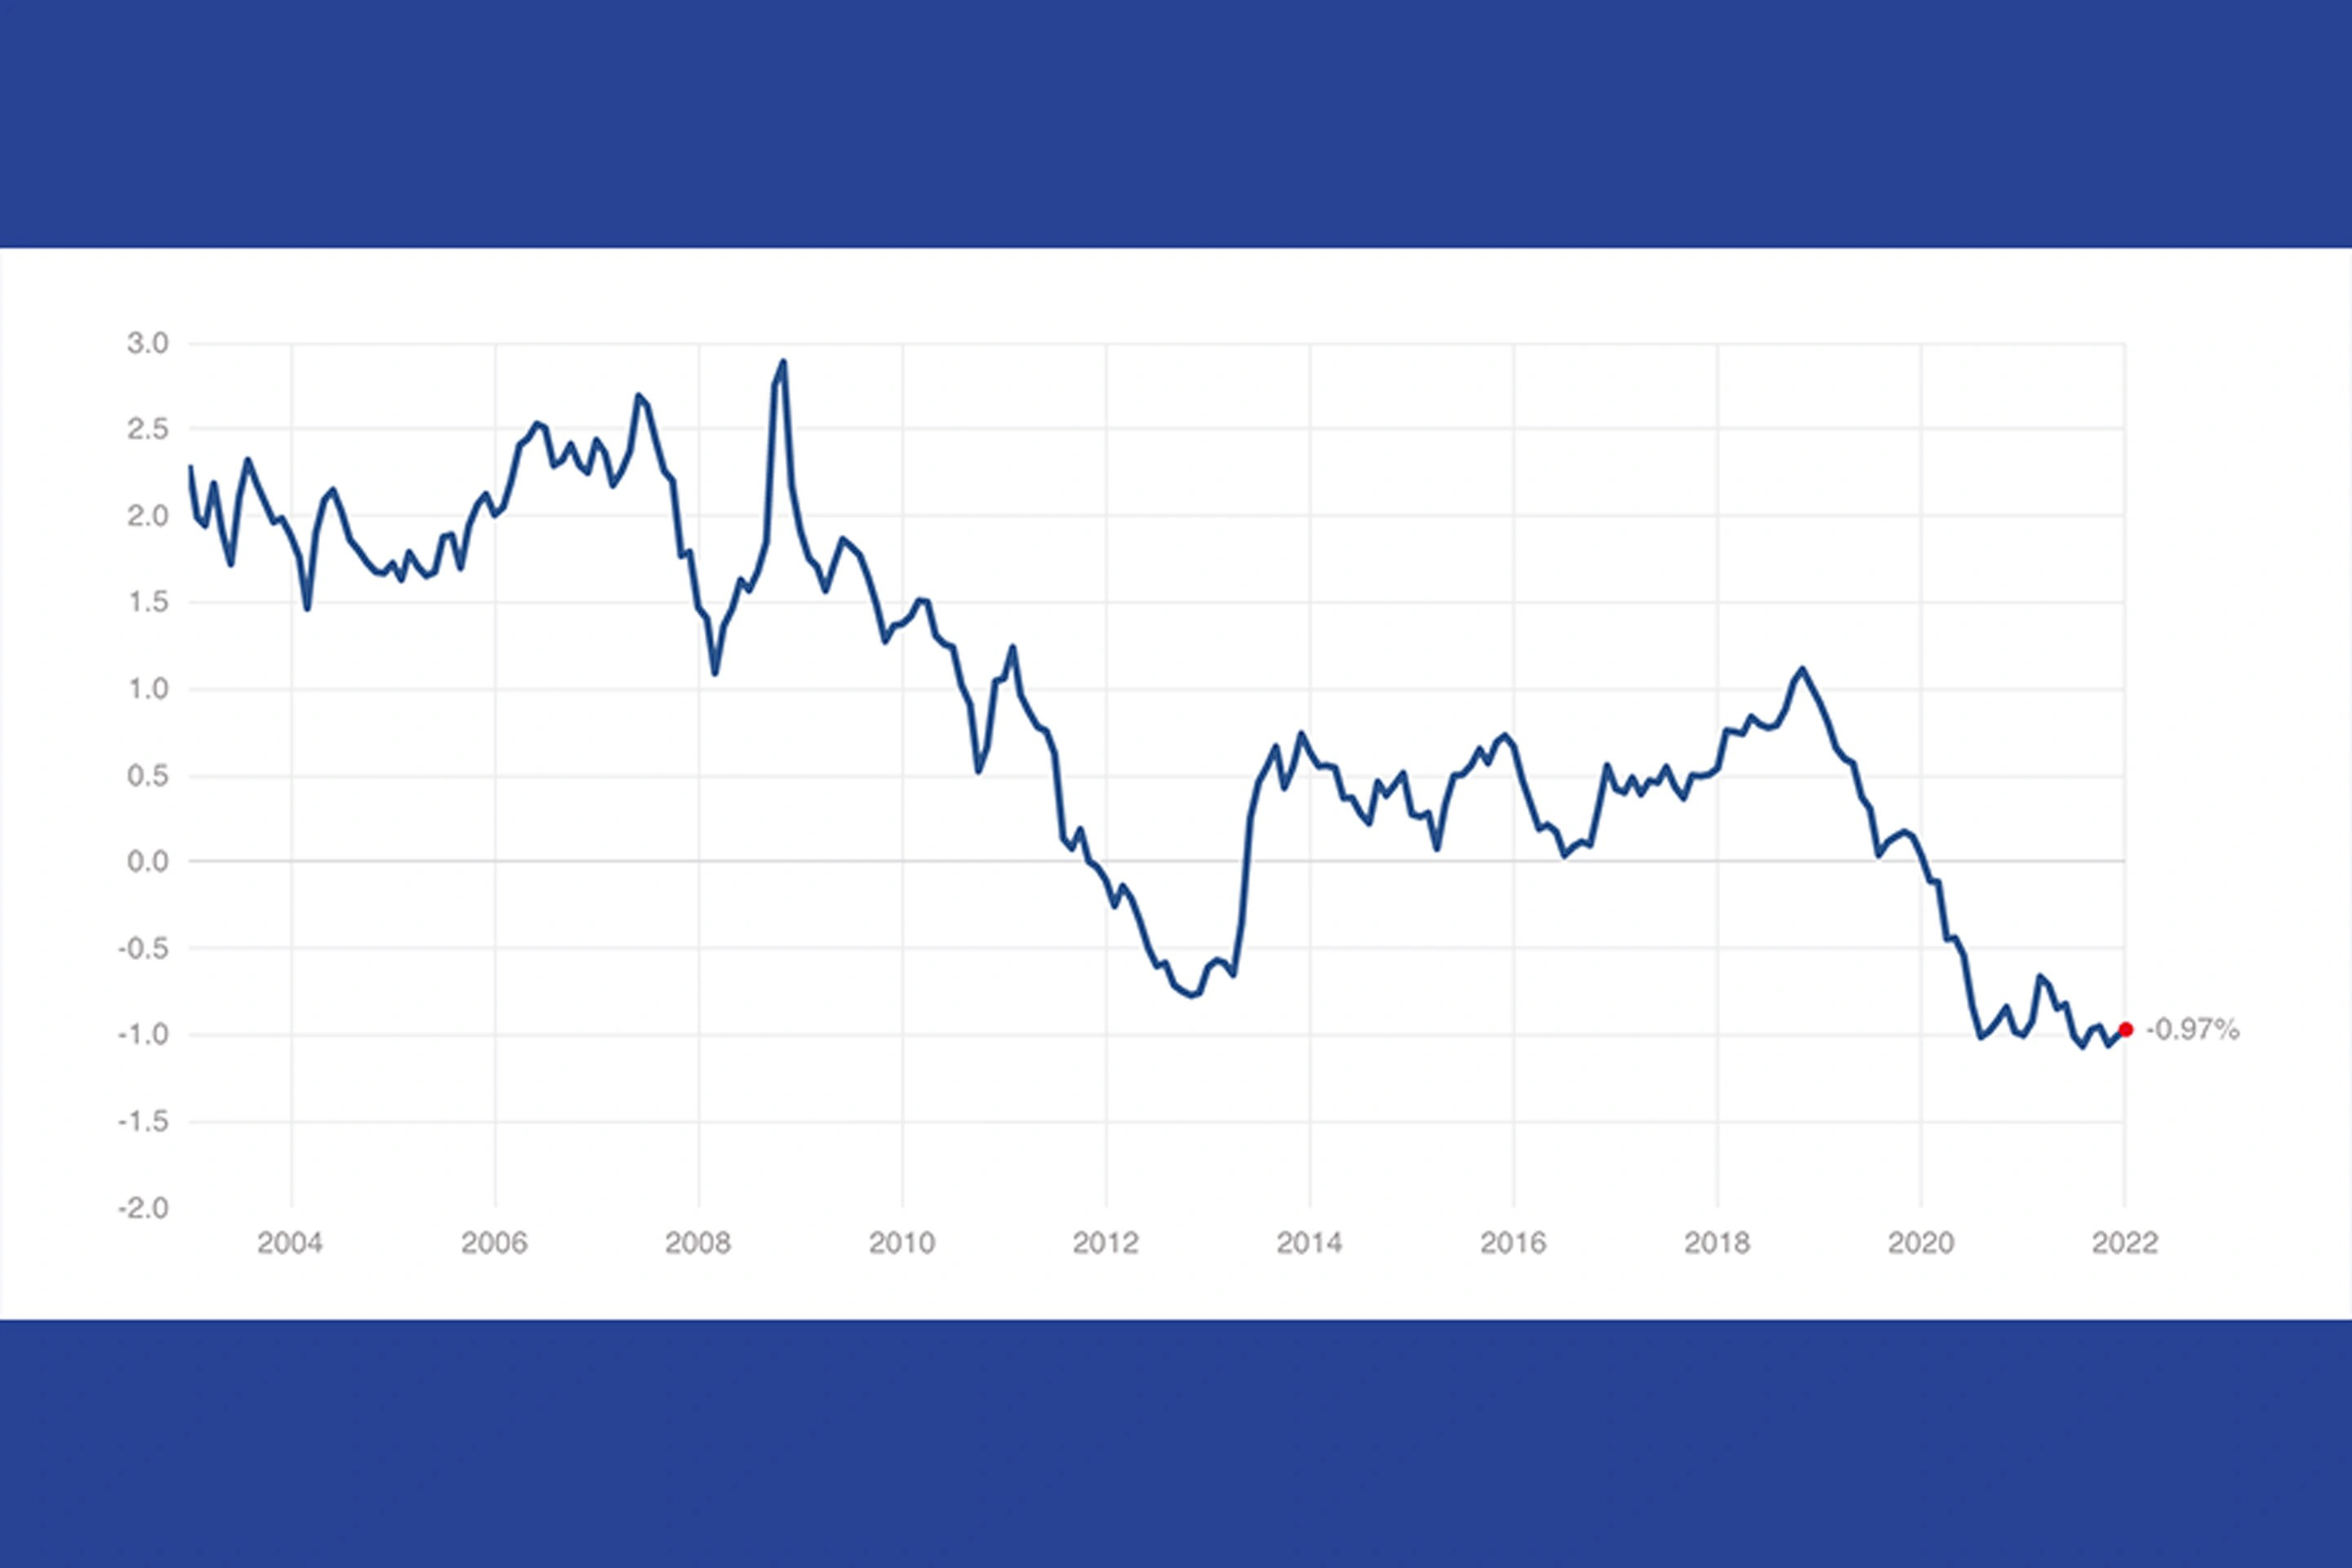
最重要的不是電腦屏幕上看到的“名義”利率,,而是經(jīng)通脹調(diào)整后的“實際”利率。只要價格漲幅保持溫和,,企業(yè)就可以提高價格保持平衡,。事實上,正是企業(yè)對汽車,、iPhone和家用電器的提價導(dǎo)致了通貨膨脹,。實際利率下降意味著債券溢價或緩沖通脹的力度越來越小,而企業(yè)只能緊隨其后提價,。債券吸引力下降,資金流入股市,,市盈率上升,。美國很少經(jīng)歷過實際利率如此低的時期。2014年至2018年年末,,經(jīng)通脹調(diào)整的10年期國債(長期債券)收益率基本上在0.5%至1.0%之間波動,。之后下降到了負1%。國債收益率下降是官方市盈率從20出頭提升到現(xiàn)在的27,,以及CAPE從20多提升到40的主要推手,。
2021年11月的會議上,美聯(lián)儲發(fā)出了提升短期和長期利率的信號?,F(xiàn)在美聯(lián)儲多數(shù)成員相信,,今明兩年美聯(lián)儲會將金融機構(gòu)間隔夜拆借利率提高三倍,從現(xiàn)在的幾乎為零提高到2022年的估計1%,,2023年提升到1.75%,。由于聯(lián)邦基金利率上升對長期債券價格造成下行壓力,而債券收益率與之相反,,將會上升,。美聯(lián)儲將在3月停止大規(guī)模購買五年或五年以上的國債,從而進一步增加壓力,。導(dǎo)致國債收益率下降的因素將消失,。
“真實”利率走向如何,?美國國會預(yù)算辦公室(Congressional Budget Office)在7月的經(jīng)濟預(yù)測中認為,2022年和2023年10年期國債經(jīng)通脹調(diào)整的收益率將為零,,本十年后期將達到1%以上,。但這一預(yù)測出現(xiàn)在美聯(lián)儲采取重大措施之前。目前尚不清楚美聯(lián)儲的新戰(zhàn)略將提升多少實際利率,,不過實際利率很可能走高,,速度比2021年夏天美國國會預(yù)算辦公室的預(yù)測快。到2023年年初,,從負1%變?yōu)檎?%似乎比較合理,。我估計,單是實際利率從1%變?yōu)?,,就會將市盈率和股價壓低20%左右,。
理由4(也許):持續(xù)通脹可能導(dǎo)致持有股票風險加大
這里的關(guān)鍵是一個著名的問題,即通脹飆升是暫時還是持久現(xiàn)象,。美聯(lián)儲預(yù)測,,一旦受阻的供應(yīng)鏈順利運行,月度價格大幅上漲將回到2%或2.5%區(qū)間,。但是,,如果野兔一般上躥下跳的走勢繼續(xù),持有股票的風險將大大增加,。公司不知道明年要支付給員工或供應(yīng)商多少錢,,所以不確定提價多少,而且現(xiàn)在還要承擔銷售額下降的風險,。此外,,消費價格不斷飆升也可能刺激美聯(lián)儲提高利率以抑制通脹,導(dǎo)致經(jīng)濟下滑從而重創(chuàng)利潤,。因此,,根深蒂固的通脹會增加所謂的“股權(quán)風險溢價”(ERP)。股權(quán)風險溢價是投資者要求的股票收益率與政府債券安全收益率的差額,。不確定性上升時,,股權(quán)風險溢價也會增加。
股權(quán)風險溢價的運作與實際利率類似,;數(shù)值越高對市盈率造成的壓力就越大?,F(xiàn)在人們都知道股權(quán)風險溢價正在上升。再加上大規(guī)模通脹,,就會迎來兇猛的組合拳,。
原因5:少數(shù)極其昂貴的股票前所未有地主宰著標準普爾500指數(shù)
2018年年底,市值最高的五只股票是微軟(Microsoft),、蘋果(Apple),、亞馬遜(Amazon),、Alphabet和伯克希爾-哈撒韋(Berkshire Hathaway),加起來占標準普爾500指數(shù)總市值(22.4萬億美元)的15.5%,。截至2021年年底,,榜單變化不大。四家科技巨頭仍然穩(wěn)居前四位,,新秀特斯拉(Tesla)取代伯克希爾-哈撒韋,,躍升至第五位。但現(xiàn)在,,市值前五名公司占標準普爾500指數(shù)總市值(43萬億美元)的近24%,。隨著新萬億美元俱樂部的市值增速遠超過標準普爾指數(shù)成分股的整體水平,在指數(shù)中的份額也迅速擴大,。反過來,,該趨勢又推動標準普爾成分股更加昂貴。原因在于,,過去三年前五名總和的市盈率大幅增加,。
蘋果的市值接近3萬億美元,市盈率32倍,,是2018年年末市盈率的兩倍多,。亞馬遜的市盈率為67倍,微軟為37倍,,特斯拉為391倍。唯一接近市場普遍水平的是谷歌母公司Alphabet,,市盈率28倍,。總體來看,,過去四個季度里五家公司的凈利潤2630億美元,,但銷售總額達10.1萬億美元。如果把五家巨頭看成一家名叫萬億俱樂部公司的大公司,,市盈率是38倍,。雖然宅經(jīng)濟(stay-at-home economy)對萬億俱樂部的推動巨大,但提振作用可能只是暫時的,,巨額盈利可能沒有堅實支撐,。
投資者期待亞馬遜和特斯拉等巨頭,還有英偉達(Nvidia)和Netflix等數(shù)十家成功企業(yè)的盈利大幅增加,,從而證明估值合理,,因此利率不斷上升對相關(guān)股票造成的打擊將格外沉重。主要原因是未來的盈利在當前價值較低,,一邊等待巨額利潤到來,,一邊思考能不能實現(xiàn)的同時,,投資者可以選擇購買收益率比現(xiàn)在高得多的債券。簡言之,,如果投資者持有標普指數(shù)基金或反映整體指數(shù)的多元化投資組合,,那么持有科技股以及特斯拉等超級明星的比例也很高。與其繼續(xù)貪婪追隨市場上耀眼的明星,,不如沉下心來,,選擇長期遭到忽視的普通股票。
標準普爾仍然有不錯的買入機會
盡管華爾街預(yù)測2022年的股市將溫和上漲,,但12個月里什么事情都有可能發(fā)生,。其實銀行真正暗示的信息是:今后多年大盤股前景不佳。
Research Affiliates預(yù)測,,未來十年標準普爾500指數(shù)的每股收益將以每年3.5%的速度增長,,投資者還能夠另外獲得1.3%股息。如果市盈率保持在目前的27倍,,情況就不會那么糟糕,。但Research Affiliates預(yù)測市盈率將大幅下降,投資者年總回報率僅為1.6%,。由于市場預(yù)測2020年代的通脹率將達到2.6%,,投資者將發(fā)現(xiàn)持有市值可購買的商品和服務(wù)每年都在減少。
標準普爾仍然有不錯的選擇,。不過主要集中在最近繁榮未涉及,,不受歡迎且受重創(chuàng)的領(lǐng)域。美國銀行推薦了三個低市盈率,、高股息且盈利穩(wěn)定的行業(yè):能源,、醫(yī)療和銀行。舉例來說,,金融機構(gòu)因為利率上升而受益,,因為存款和貸款之間的利差加大。醫(yī)療能源則受益于強大的定價能力,。
華爾街看淡今年市場是個明證,,表明連一直鼓吹上漲的啦啦隊長也認為市場瘋狂已經(jīng)持續(xù)太久??偛荒苋胧袝r眼前一片花里胡哨的高價,,還期望能夠賺到大錢。
是時候理解暗示放平心態(tài)了,。(財富中文網(wǎng))
譯者:夏林
2021年11月底和12月初,,華爾街的市場策略師沿襲了由來已久的節(jié)日儀式,即預(yù)測新一年的標準普爾500指數(shù)(S&P 500)點位。傳統(tǒng)上,,即使在基本面提示應(yīng)該謹慎,,比如相對歷史基準股價顯示出明顯高估跡象,預(yù)測者也會不切實際地偏向多頭,。2020年年底的股票看起來已經(jīng)很昂貴,,多數(shù)銀行還是預(yù)測2021年漲幅可達兩位數(shù)。摩根大通(J.P. Morgan)最樂觀,,預(yù)測漲幅達17%,,其次是高盛(Goldman Sachs)和瑞銀(UBS),預(yù)測漲幅分別為14%和11%,。美國銀行(Bank of America)和花旗集團(Citigroup)未跟隨大流,,發(fā)出了泡沫警告,預(yù)測增幅也最小,,不過沒有一家華爾街巨頭預(yù)計出現(xiàn)大幅下跌,。
當然,實際情況是在象征幸運的知更鳥的喧囂中,,2021年投資者將標準普爾500指數(shù)推高了27.2%,,收于4766點。井噴后大盤股進入全新領(lǐng)域,,以可靠標準衡量,,大盤股價比1998年至2000年科技泡沫以來都昂貴。
然而,,人們可能認為銀行會想方設(shè)法吹捧2022年前景大好,。我期待著跟往年一樣特別正面的預(yù)期,銀行宣稱有望超越超高估值,,推動標準普爾指數(shù)漲幅再次達到兩位數(shù),。令人驚訝的是,事實并非如此,。2021年年底,,華爾街發(fā)布的股價報告數(shù)量極為有限,,而且處處是警告,。提醒投資者:如果連股票的終極炒作工廠都認為未來12個月內(nèi)大盤股走勢幾乎持平,可能預(yù)期里還要加大折扣,。
當然,,即便是最可靠的市場指標也無法預(yù)測短短一年內(nèi)股票的走勢。諸如表情包熱之類現(xiàn)象,,還有推動電動汽車制造商和技術(shù)熱門公司股票估值高到驚人,,導(dǎo)致短期預(yù)測非常不可靠的驚人勢頭。網(wǎng)絡(luò)狂潮期間,1997年年中,,標準普爾指數(shù)看起來高估到危險的程度,,但在不可避免的崩潰之前,標準普爾還是繼續(xù)飆升了三年,。這一次,,華爾街發(fā)出了警告。銀行對2022年謹慎的稱贊,,還有為未來一年“疲軟”引述的各種理由都是強大的障礙,。說明不只今后12個月,長久的未來回報都將低迷,。
華爾街預(yù)測2022年收益微乎其微
與2021年的收獲相比,,銀行對今年標準普爾500指數(shù)目標關(guān)乎低位高點和低位低點。在預(yù)測2022年年底點位的九家大型銀行中,,最樂觀的預(yù)測來自瑞士信貸(Credit Suisse),。瑞信預(yù)計指數(shù)將接近5100,標準普爾500指數(shù)漲幅將達到9.1%,,遠低于摩根大通預(yù)測的2021年上漲17%,。預(yù)測點位第二高的是高盛,預(yù)測漲幅7%,,隨后是摩根大通和蘇格蘭皇家銀行(RBC)均為6%,、德意志銀行(Deutsche Bank)為4.9%和花旗銀行(Citi Bank)為2.8%。最讓人驚訝的是平淡和負面預(yù)期,。巴克萊銀行(Barclays)預(yù)計標準普爾500指數(shù)僅增長0.7%,,而美國銀行預(yù)計下跌3.5%。最悲觀的是摩根士丹利(Morgan Stanley),,預(yù)計到2022年年底,,標準普爾指數(shù)將下跌7.7%。
九家銀行的平均預(yù)測增幅為2.8%,。標準普爾還會派息1.3%,。再加上2.8%的資本收益,華爾街明確預(yù)計2022年總回報率為4.1%,。2021年11月,,消費者價格指數(shù)(CPI)飆升至6.8%,即便通脹如美聯(lián)儲(Federal Reserve)預(yù)測放緩至2.6%,,如果銀行突然謹慎的專家預(yù)測準確,,投資者的“實際”收益就只能說微乎其微。
不過讓華爾街對2022年偏消極的推動力并未消失,,而且比追求積極的智者承認的強大得多,。未來12個月內(nèi)各種不利因素可能不會出現(xiàn),,但未來幾年將嚴重影響股價。對未來回報來說,,基本面似乎很糟糕,。以下是長期來看股票表現(xiàn)不佳的五個原因。
理由1:估值高到危險程度
要評估股票高估程度,,不僅要看價格相對于收益上漲了多少,,還要看當前巨額利潤是否可持續(xù)。如果不可持續(xù),,官方市盈率(P/E)就大大低估了股票的昂貴程度,。
2021年年底根據(jù)截至去年三季度每股收益(EPS)計算,標準普爾500指數(shù)的市盈率為27.2倍,。排除2000年幾個季度利潤暴跌導(dǎo)致市盈率膨脹,,該市盈率為20年前的科技泡沫以來最高。華爾街的狂熱者聲稱,,當前基于未來收益的市盈率仍然在合理范圍內(nèi),,因為利潤將持續(xù)飆升。但他們錯了,。事實上,,企業(yè)利潤處于泡沫高點,已經(jīng)沒有擴張空間,。即便收益增長也無法拯救當前極高的估值,。
2019年四季度,標準普爾500指數(shù)的每股收益創(chuàng)下139.47美元的歷史新高,。然后新冠病毒席卷而來,,大盤股公司利潤從強勁變?yōu)楹郎荨U疄閼?yīng)對危機投入大量資金,,為家庭帶來數(shù)萬億美元現(xiàn)金,。從電腦設(shè)備到改造農(nóng)場或土地,人們大手筆購買各種家庭用品和服務(wù),。從2021年二季度開始,,盈利出現(xiàn)了幾十年來從未出現(xiàn)的大幅上漲,2021年三季度躍升至175美元,,比15個月前設(shè)定目標的高點多出25%,。問題在于:營業(yè)利潤率以及盈利都觸及天花板。2021年三季度標準普爾500指數(shù)成份股公司營業(yè)利潤率達到13.2%,,高過了2019年四季度的10.6%,,當時標準普爾點位達到新冠疫情前高點,。目前,,銷售占營業(yè)收入的比例比過去12年平均水平高出40%。
如今,不斷上漲的勞動力成本正在壓縮盈利,。Research Affiliates的首席執(zhí)行官兼首席投資官克里斯·布萊曼告訴《財富》雜志,,利潤快速增長的時代已經(jīng)結(jié)束。Research Affiliates負責管理1660億美元共同基金和ETF的投資策略,。他預(yù)測,,在本十年的大部分時間里,每股收益很可能出現(xiàn)橫向波動,,與通脹基本持平,。
原因2:席勒市盈率亮紅燈
決定未來回報豐厚還是貧瘠的最佳標準是看起點。如果整體價格便宜,,付出的每一美元就都能夠獲得大量利潤,,感覺就像盒子里裝滿了脆米花,豐收的可能性比較高,。如果股票現(xiàn)在賺的錢少,,那么要獲得兩位數(shù)的收益,最好期盼企業(yè)利潤可以實現(xiàn)快速增長,。
然而,,當前利潤實在巨大,除了下跌或橫盤已經(jīng)無處可去,。一個有價值的指標表明,,如果從每股收益中剔除無法維持的峰值,剩下的“正?;崩麧櫟偷枚?。結(jié)果是為每股支付的美元遠高于可期待的利潤。判斷標準是耶魯大學的經(jīng)濟學家,,也是諾貝爾獎的獲得者羅伯特·希勒制定的周期調(diào)整市盈率(CAPE),。CAPE計算過去10年平均每股收益(經(jīng)通脹調(diào)整),消除短期利潤高峰和低谷造成的扭曲,。事實上,,希勒市盈率是預(yù)測未來十年股市表現(xiàn)最可靠的指標之一。
現(xiàn)在,,CAPE達到40倍,。自1877年以來,CAPE達到如此高僅出現(xiàn)過一次,,就是1998年年初至2000年年底的互聯(lián)網(wǎng)熱潮,,持續(xù)了21個月。接下來的三年里,,CAPE指標下降了43%,;過了13年,,標準普爾的席勒市盈率才恢復(fù)到接近40的水平。
理由3:“真實”利率將上升,,最終導(dǎo)致市盈率崩潰
最令華爾街困擾的是美聯(lián)儲最近承諾明年加息,。解釋2022年的目標點位時,各銀行承認美聯(lián)儲政策轉(zhuǎn)變會為當前超高市盈率造成壓力,。這是美國銀行的分析師薩維塔·薩布拉瑪尼安預(yù)測今年標準普爾將下跌3.5%的重要原因,。由于波動性股票與無風險債券都在爭取投資者的資金,國債收益率越低,,投資者就越愿意為風險更高的對家買單,。沃倫·巴菲特強調(diào),10年期國債收益率從1984年的13%以上降到2000年代中期的4%,,是推動多年牛市的首要因素,。近幾年來,美聯(lián)儲政策變成愈加強力的補藥,,股市看多派聲勢日益浩大,。
最重要的不是電腦屏幕上看到的“名義”利率,而是經(jīng)通脹調(diào)整后的“實際”利率,。只要價格漲幅保持溫和,,企業(yè)就可以提高價格保持平衡。事實上,,正是企業(yè)對汽車,、iPhone和家用電器的提價導(dǎo)致了通貨膨脹。實際利率下降意味著債券溢價或緩沖通脹的力度越來越小,,而企業(yè)只能緊隨其后提價,。債券吸引力下降,資金流入股市,,市盈率上升,。美國很少經(jīng)歷過實際利率如此低的時期。2014年至2018年年末,,經(jīng)通脹調(diào)整的10年期國債(長期債券)收益率基本上在0.5%至1.0%之間波動,。之后下降到了負1%。國債收益率下降是官方市盈率從20出頭提升到現(xiàn)在的27,,以及CAPE從20多提升到40的主要推手,。
2021年11月的會議上,美聯(lián)儲發(fā)出了提升短期和長期利率的信號?,F(xiàn)在美聯(lián)儲多數(shù)成員相信,,今明兩年美聯(lián)儲會將金融機構(gòu)間隔夜拆借利率提高三倍,從現(xiàn)在的幾乎為零提高到2022年的估計1%,,2023年提升到1.75%,。由于聯(lián)邦基金利率上升對長期債券價格造成下行壓力,,而債券收益率與之相反,將會上升,。美聯(lián)儲將在3月停止大規(guī)模購買五年或五年以上的國債,從而進一步增加壓力,。導(dǎo)致國債收益率下降的因素將消失,。
“真實”利率走向如何?美國國會預(yù)算辦公室(Congressional Budget Office)在7月的經(jīng)濟預(yù)測中認為,,2022年和2023年10年期國債經(jīng)通脹調(diào)整的收益率將為零,,本十年后期將達到1%以上。但這一預(yù)測出現(xiàn)在美聯(lián)儲采取重大措施之前,。目前尚不清楚美聯(lián)儲的新戰(zhàn)略將提升多少實際利率,,不過實際利率很可能走高,速度比2021年夏天美國國會預(yù)算辦公室的預(yù)測快,。到2023年年初,,從負1%變?yōu)檎?%似乎比較合理。我估計,,單是實際利率從1%變?yōu)?,,就會將市盈率和股價壓低20%左右。
理由4(也許):持續(xù)通脹可能導(dǎo)致持有股票風險加大
這里的關(guān)鍵是一個著名的問題,,即通脹飆升是暫時還是持久現(xiàn)象,。美聯(lián)儲預(yù)測,一旦受阻的供應(yīng)鏈順利運行,,月度價格大幅上漲將回到2%或2.5%區(qū)間,。但是,如果野兔一般上躥下跳的走勢繼續(xù),,持有股票的風險將大大增加,。公司不知道明年要支付給員工或供應(yīng)商多少錢,所以不確定提價多少,,而且現(xiàn)在還要承擔銷售額下降的風險,。此外,消費價格不斷飆升也可能刺激美聯(lián)儲提高利率以抑制通脹,,導(dǎo)致經(jīng)濟下滑從而重創(chuàng)利潤,。因此,根深蒂固的通脹會增加所謂的“股權(quán)風險溢價”(ERP),。股權(quán)風險溢價是投資者要求的股票收益率與政府債券安全收益率的差額,。不確定性上升時,股權(quán)風險溢價也會增加,。
股權(quán)風險溢價的運作與實際利率類似,;數(shù)值越高對市盈率造成的壓力就越大?,F(xiàn)在人們都知道股權(quán)風險溢價正在上升。再加上大規(guī)模通脹,,就會迎來兇猛的組合拳,。
原因5:少數(shù)極其昂貴的股票前所未有地主宰著標準普爾500指數(shù)
2018年年底,市值最高的五只股票是微軟(Microsoft),、蘋果(Apple),、亞馬遜(Amazon)、Alphabet和伯克希爾-哈撒韋(Berkshire Hathaway),,加起來占標準普爾500指數(shù)總市值(22.4萬億美元)的15.5%,。截至2021年年底,榜單變化不大,。四家科技巨頭仍然穩(wěn)居前四位,,新秀特斯拉(Tesla)取代伯克希爾-哈撒韋,躍升至第五位,。但現(xiàn)在,,市值前五名公司占標準普爾500指數(shù)總市值(43萬億美元)的近24%。隨著新萬億美元俱樂部的市值增速遠超過標準普爾指數(shù)成分股的整體水平,,在指數(shù)中的份額也迅速擴大,。反過來,該趨勢又推動標準普爾成分股更加昂貴,。原因在于,,過去三年前五名總和的市盈率大幅增加。
蘋果的市值接近3萬億美元,,市盈率32倍,,是2018年年末市盈率的兩倍多。亞馬遜的市盈率為67倍,,微軟為37倍,,特斯拉為391倍。唯一接近市場普遍水平的是谷歌母公司Alphabet,,市盈率28倍,。總體來看,,過去四個季度里五家公司的凈利潤2630億美元,,但銷售總額達10.1萬億美元。如果把五家巨頭看成一家名叫萬億俱樂部公司的大公司,,市盈率是38倍,。雖然宅經(jīng)濟(stay-at-home economy)對萬億俱樂部的推動巨大,但提振作用可能只是暫時的,巨額盈利可能沒有堅實支撐,。
投資者期待亞馬遜和特斯拉等巨頭,,還有英偉達(Nvidia)和Netflix等數(shù)十家成功企業(yè)的盈利大幅增加,從而證明估值合理,,因此利率不斷上升對相關(guān)股票造成的打擊將格外沉重,。主要原因是未來的盈利在當前價值較低,一邊等待巨額利潤到來,,一邊思考能不能實現(xiàn)的同時,,投資者可以選擇購買收益率比現(xiàn)在高得多的債券。簡言之,,如果投資者持有標普指數(shù)基金或反映整體指數(shù)的多元化投資組合,,那么持有科技股以及特斯拉等超級明星的比例也很高,。與其繼續(xù)貪婪追隨市場上耀眼的明星,,不如沉下心來,選擇長期遭到忽視的普通股票,。
標準普爾仍然有不錯的買入機會
盡管華爾街預(yù)測2022年的股市將溫和上漲,,但12個月里什么事情都有可能發(fā)生。其實銀行真正暗示的信息是:今后多年大盤股前景不佳,。
Research Affiliates預(yù)測,,未來十年標準普爾500指數(shù)的每股收益將以每年3.5%的速度增長,投資者還能夠另外獲得1.3%股息,。如果市盈率保持在目前的27倍,,情況就不會那么糟糕。但Research Affiliates預(yù)測市盈率將大幅下降,,投資者年總回報率僅為1.6%,。由于市場預(yù)測2020年代的通脹率將達到2.6%,投資者將發(fā)現(xiàn)持有市值可購買的商品和服務(wù)每年都在減少,。
標準普爾仍然有不錯的選擇,。不過主要集中在最近繁榮未涉及,不受歡迎且受重創(chuàng)的領(lǐng)域,。美國銀行推薦了三個低市盈率,、高股息且盈利穩(wěn)定的行業(yè):能源、醫(yī)療和銀行,。舉例來說,,金融機構(gòu)因為利率上升而受益,因為存款和貸款之間的利差加大,。醫(yī)療能源則受益于強大的定價能力,。
華爾街看淡今年市場是個明證,表明連一直鼓吹上漲的啦啦隊長也認為市場瘋狂已經(jīng)持續(xù)太久,??偛荒苋胧袝r眼前一片花里胡哨的高價,,還期望能夠賺到大錢。
是時候理解暗示放平心態(tài)了,。(財富中文網(wǎng))
譯者:夏林
In late November and early December, Wall Street’s market strategists observe a time-honored holiday ritual: predicting where the S&P 500 will finish in the new year. Traditionally, these forecasters mainly form a herd of cockeyed bulls even when fundamentals suggest caution, as when shares show clear signs of being overpriced versus historical benchmarks. Though stocks looked extremely expensive at the close of 2020, most of the banks forecast double-digit gains for last year. J.P. Morgan was most optimistic at 17%, followed by Goldman Sachs (14%), and UBS (11%). Bank of America and Citigroup bucked the mainstream by warning of froth and predicting a minimal rise, but none of the Street’s stalwarts foresaw an outright decline.
Of course, investors swamped even the bluebird calls by lifting the S&P 500 by 27.2% last year to close at 4766. That blowout took big-caps into territory that by reliable yardsticks makes them pricier than at any time since the tech bubble of 1998 to 2000.
Nevertheless, you’d think that the banks would find ways to tout 2022 as a winner. I was expecting the usual practice of spotlighting special positives that promise to surmount super-high valuations and propel the S&P to still another double-digit performance. Amazingly, that’s not the case. At year-end, Wall Street issued guidance that’s both ultra-modest in numbers and rife with warnings. Memo to investors: If the ultimate hype factory for stocks sees big-caps practically flatlining over the next 12 months, you might want to add a steep discount.
Of course, even the most reliable market metrics don’t tell you much if anything about how shares will fare in any period as short as a year. Such phenomena as the meme craze and breakneck momentum that’s driven shares of EV makers and tech darlings to incredible valuations render short-term forecasts highly unreliable. In the dotcom frenzy, the S&P looked dangerously overvalued in mid-1997, yet kept soaring for three more years before the inevitable collapse. This time, Wall Street is sending us a warning wink. The banks’ faint praise for 2022, the reasons they are citing for a “weak” year ahead, are durable roadblocks that point well beyond the next 12 months to poor returns stretching far into the future.
Wall Street is predicting puny gains for 2022
Compared with the 2021 crop, the bank’s S&P 500 targets for this year are a story of lower highs and lower lows. Among nine large players that provided year-end estimates for 2022, the most favorable forecast came from Credit Suisse. It predicted a close of 5100, garnering a gain of 9.1% for the 500, well below the 2021 “high” of 17% posited by J.P. Morgan. In second place sat Goldman at 7%, followed by J.P. Morgan and RBC (both 6%), Deutsche Bank (4.9%), and Citi (2.8%). The biggest surprises were the flat and negative outlooks. Barclays sees an increase of just 0.7%, while Bank of America predicts a decline of 3.5%. Most bearish is Morgan Stanley, reckoning that the S&P will drop 7.7% by New Year’s Eve of 2022.
The average for the nine targets is a rise of 2.8%. The S&P is also delivering 1.3% in dividends. Add that to a 2.8% capital gain, and Wall Street writ large foresees a total return of 4.1% for 2022. In November, the consumer price index raced at 6.8%, and even if inflation slows to the 2.6% forecast by the Fed, investors would pocket only puny “real” gains if the banks’ suddenly chastened experts are right.
But the forces that make Wall Street mildly negative on 2022 aren’t going away, and they’re a lot stronger than the bright-side-seeking sages acknowledge. Those headwinds may not even make their mark in the next 12 months, but they will weigh heavily on prices for years to come. The fundamentals look bad for future returns. Here are the five reasons stocks will do poorly over a long horizon.
Reason 1: Valuations are dangerously stretched
To assess how stretched equities have become, it’s necessary to examine not just how much prices have risen relative to earnings, but whether today’s gigantic profits are sustainable. If they’re not, the official price/earnings multiple (P/E) is vastly understating how expensive equities really are.
As of year-end, the S&P 500’s P/E, based on earnings per share (EPS) through Q3 of last year, stood at 27.2. That’s by far the highest number since the tech bubble two decades ago, excluding a couple of quarters in 2000 when collapsing profits inflated multiples. Wall Street’s enthusiasts claim that today’s P/E based on future earnings remains in the reasonable range because profits will keep surging. But they’re wrong. In reality, corporate profits are at bubble highs that leave no room for expansion. Earnings growth can’t bail out today’s huge valuations.
In the fourth quarter of 2019, S&P 500 profits hit an all-time high of $139.47. Then in the COVID comeback, big-cap companies went from strongly to sumptuously profitable. Generous government outlays to combat the crisis handed families trillions in cash that they lavished on stay-at-home products and services from computer gear to remodeling their ranch or colonial. Starting in Q2 of last year, earnings went on a tear not seen in decades, jumping to $175 in Q3 of last year, dwarfing the summit set just 15 months earlier by 25%. The problem: Operating margins—and hence earnings—are hitting a wall. In Q3 of 2021, they reached 13.2%, compared with 10.6% in Q4 of 2019 when the S&P achieved that pre-COVID peak. Right now, the share of sales going to operating income is 40% higher than the average over the past 12 years.
Today, rising labor costs are shrinking that bulge. Chris Brightman, CEO and chief investment officer at Research Affiliates, a firm that oversees strategies for $166 billion in mutual funds and ETFs, tells Fortune that the era of fast-rising profits is over. He predicts that EPS is likely to go sideways, simply matching inflation, through much of this decade.
Reason 2: The Shiller P/E is flashing red
The best metric for determining whether future returns will be rich or poor is where you start. If overall prices are cheap, you get a lot of profits for each dollar you’re paying—the box is packed with Rice Krispies—and you’re likely to do great. If your stocks are netting fewer bucks now, the bottom line had better grow fast to hand you double-digit gains.
But today’s profits are so immense they have nowhere to go but down or sideways. A valuable metric demonstrates that if we take the untenable spike out of EPS, we’re left with “normalized” profits that are much lower. That makes the dollars you’re paying for each share, versus the dollars you can count on in profits, much higher than they appear. The yardstick is the cyclically adjusted price/earnings ratio (CAPE) developed by Yale economist and Nobel laureate Robert Shiller. The CAPE removes distortions from temporary spikes and valleys in profits by averaging EPS over the previous 10 years, adjusted for inflation. Indeed, the Shiller P/E ranks among the most powerful predictors of what stocks will deliver over the following decade.
Today, the CAPE registers 40. It’s been that high in only one period since 1877, for 21 months during the dotcom frenzy lasting from the start of 1998 to late 2000. Over the next three years, the index dropped 43%; it took 13 years for the S&P to regain the levels late in the period where the Shiller P/E exceeded 40.
Reason 3: ‘Real’ rates will rise, crushing multiples
It’s the Fed’s recent pledge to raise rates next year that most bothers Wall Street. In explaining their 2022 targets, the banks acknowledge that the Fed’s shift will pressure today’s super-high P/Es. It’s a major factor in Savita Subramanian of BofA’s forecast that the S&P will shed 3.5% this year. Since volatile equities compete with risk-free bonds, the less Treasuries are yielding the more investors will pay for their chancier rival. Warren Buffett highlights the drop in the 10-year Treasury yield from over 13% in 1984 to 4% in the mid-2000s as the top factor driving the multiyear bull market. The Fed has served up an even stronger tonic in recent years that’s kept the party roaring.
What matters most isn’t the “nominal” rate you see on your computer screen, but the “real” rate, adjusted for inflation. As long as price increases remain moderate, companies can raise prices to stay even; indeed, the increases in what companies charge for cars, iPhones, and appliances are what generate inflation. Falling real rates mean that bonds are offering a lower and lower premium, or cushion, over inflation, while companies are keeping up. Bonds get less attractive, and money flows into stocks, swelling P/Es. The U.S. has seldom experienced a period of real rates this low. From 2014 to late 2018, the inflation-adjusted yield the 10-year Treasury (long bond) floated mainly between 0.5% and 1.0%. Since then it’s fallen to a negative 1%. That descent has been the principal lever in hiking the official P/E from the low 20s to today’s 27, and the CAPE from the mid-20s to 40.
In its November meeting, the Fed signaled moves that will raise both short- and long-term rates. The majority of Fed members now believe that the central bank will increase the overnight rate at which financial institutions lend to one another three times in this year and next, from almost zero today to an estimated 1% in 2022 and 1.75% in 2023. Since the Fed funds rate exerts a gravitational pull on prices of longer-term bonds, their rates, which move in the opposite direction, will rise. The Fed will augment that pressure by ending its massive purchases on Treasuries maturing in five years or more in March; the program that’s greatly contributed to depressing yields will end.
How high are “real” rates likely to go? In its July economic forecast, the Congressional Budget Office viewed the inflation-adjusted yield on the 10-year hitting zero in 2022 and 2023, and reaching over 1% later in the decade. But that forecast came before the the Fed’s big move. It isn’t clear how much the Fed’s new strategy will lift real rates, but they’re likely to go higher, quicker than the CBO posited last summer. A swing from minus 1% to a positive 1% by early 2023 would seem plausible. By my reckoning, a shift of 1% to a real rate of 0 alone would hammer P/Es and prices by around 20%.
Reason 4 (maybe): Persistent inflation could make holding stocks riskier
Here’s one that hinges on the famous question of whether the inflation surge is temporary or durable. The Fed predicts that big monthly price increases will return to the 2% or 2.5% range once blocked supply chains are operating smoothly. But if the jackrabbit jumps we’re seeing continue, holding stocks will get a lot riskier. Companies won’t know what they will be paying workers or suppliers next year, making them unsure how much to raise prices, and risk falling sales, today. In addition, surging consumer prices raise the threat that the Fed will jack up rates to tame inflation, causing a downturn that will pound profits. Hence, entrenched inflation would increase what’s called the “equity risk premium” or ERP. That’s the margin investors demand over and above the yield on safe government bonds. When uncertainty rises, so does the equity risk premium.
The ERP operates like the real rate; the higher it goes, the more pressure it puts on multiples. We know the former is going up. Add big inflation to the mix, and you get a devastating one-two punch.
Reason 5: A handful of wildly expensive stocks are dominating the S&P 500 as never before
At the end of 2018, the five stocks boasting the largest market caps were Microsoft, Apple, Amazon, Alphabet and Berkshire Hathaway. Combined, they accounted for 15.5% of the 500’s total value of $22.4 trillion. By the close of 2021, the list hadn’t changed much: The four tech titans still occupied the top slots, and newcomer Tesla replaced Berkshire at five. But now, the top 5 tally to almost 24% of the index’s total cap of $43 trillion. As the values of the newly minted trillion-dollar club grew much faster than the overall S&P, they mushroomed into an oversize share of the index. In turn, that trend made the S&P much more expensive. The reason: The top five in combination are selling at a P/E that’s grown enormously over the past three years.
At an almost $3 trillion valuation, Apple is selling at a P/E of 32, more than twice its multiple in late 2018. Amazon sports a P/E of 67, Microsoft 37, and Tesla a Brobdingnagian 391. The only member with a near-market number is Alphabet at 28. All told, the five generated $263 billion in net income in their last four quarters, but are selling in total for $10.1 trillion. If you considered them as one big company called the Trillion Club Inc., their multiple would be 38. And those big earnings may not have legs given the huge, possibly ephemeral boost to the club from the stay-at-home economy.
Since investors are counting on big earnings increases from the likes of Amazon and Tesla, as well as the same from scores of high-fliers from Nvidia to Netflix, to justify their huge valuations, rising rates will hit these stocks disproportionately hard. That’s because earnings that arrive in the future are worth less today because while they are waiting for the big profits to arrive—and wondering if it will happen—investors will have the option of buying bonds that offer much better yields than today. Put simply, investors who own an S&P index fund or diversified portfolio reflecting the overall index are way overweight in expensive tech stocks and maybe-superstars such as Tesla. Instead of continuing to gorge on the names that have thrived, this is the moment for embracing the overlooked and unglamorous.
The S&P still offers good buys
While Wall Street is predicting slightly positive gains in 2022, and anything could happen in a 12-month span, here’s the real message that the banks only hint at: The multiyear outlook for big-caps is poor.
Research Affiliates predicts that over the next decade, S&P 500 earnings per share will grow at just 3.5% a year, and that you’ll get another 1.3% in dividends. That scenario wouldn’t be so bad if multiples remained at the current, towering 27. But Research Affiliates predicts P/Es will shrink dramatically, leaving investors with a total annual return of just 1.6%. Since the markets are predicting 2.6% inflation through the 2020s, investors would witness what their holdings could buy in goods and services sliding with each passing year.
The S&P still offers good deals. But they are virtually all in unloved, beaten-down sectors that the recent boom missed. BofA recommends three sectors featuring low P/Es, high dividends, and stable earnings: energy, health care, and banks. The financials, for example, benefit from rising rates because they swell the spread between what they pay for deposits and charge for loans. Health care and energy should benefit from strong pricing power.
Wall Street’s dim view of the markets for this year is a tell, signaling that even the cheerleaders believe the craziness has gone on too long. You can’t start with dizzyingly high prices and expect to still make good money.
It’s time to take the hint.
請打開財富Plus APP